Your Score Cutoff Is Beta. Your Portfolio Thesis Is Alpha.
Your credit score cutoff is beta: same score, same threshold, same book as every peer. Alpha is everything else. What it means & the levers that build it.
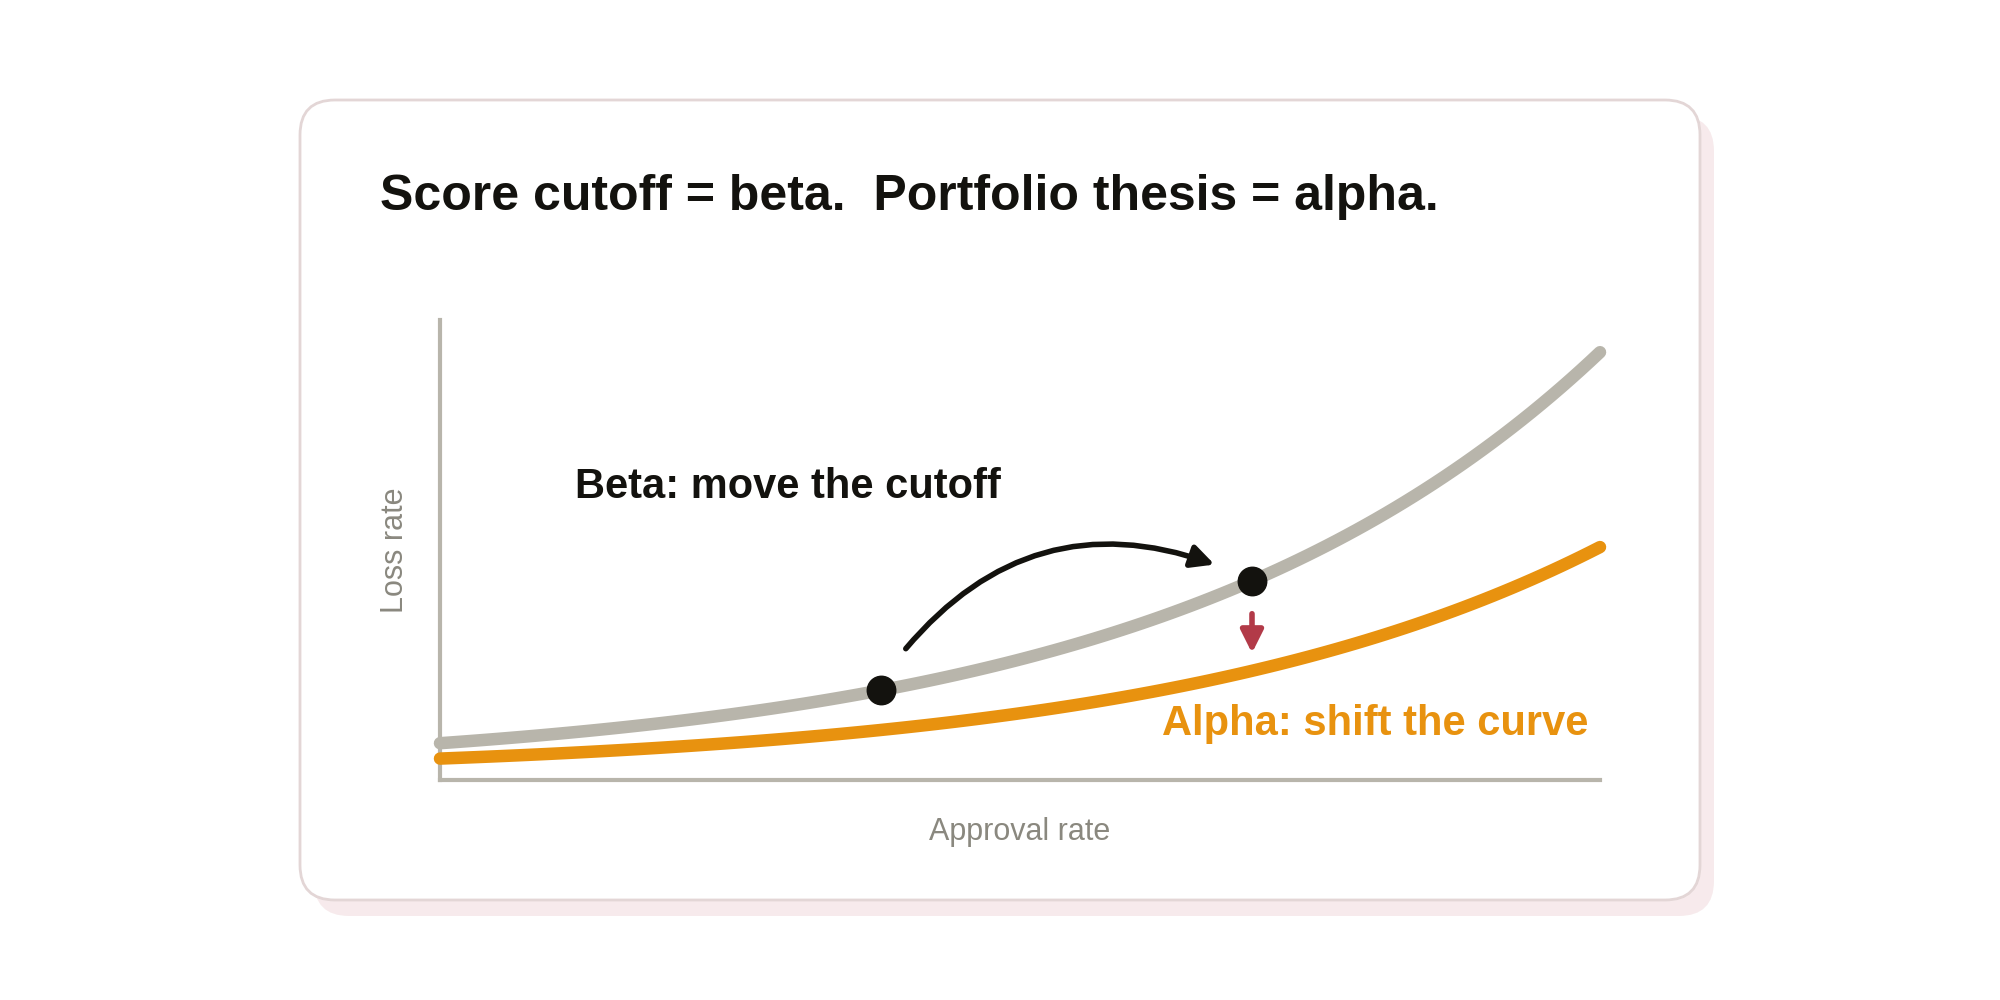
Why your score cutoff is beta, what alpha looks like in a lending book & the levers that build it.
Key takeaways
- Your score cutoff is beta. Anyone using the same bureau score at the same threshold inherits the same risk/return profile.
- Alpha is everything else: the risk-adjusted yield you earn above what a peer using the same score at the same cutoff would earn.
- Alpha shows up as a shift in the risk frontier, not just a cutoff move: better approval at the same risk, or lower risk at the same approval rate.
1. What do beta & alpha mean in a lending portfolio?
In portfolio management, beta is the return you get from being exposed to the market. Alpha is the return above what that exposure alone would have delivered against a benchmark (a quick primer on alpha vs. benchmark & beta returns). Beta is available to everyone & it’s cheap. Alpha takes a view, a process & an edge.
A lending portfolio works the same way.
- Beta is your score cutoff. Pull the same bureau score, set a threshold & you inherit the same risk/return profile as every other lender doing the same thing in your segment. When the credit cycle turns, your book moves with the market. Tightening or loosening the cutoff is a beta lever. Everyone has it.
- Alpha is everything else. It’s the risk-adjusted yield you earn above what a peer using the same score at the same cutoff would earn. It comes from knowing which segments the score misprices, which channels bring better borrowers, which data actually moves the risk frontier, how to price against your cost of funds & where policy or macro is about to shift the ground under a specific sub-segment.
| Beta: the credit score cutoff | Alpha: the portfolio thesis | |
|---|---|---|
| What it is | The risk/return you inherit by using the same bureau score at the same threshold as peers in your segment | The risk-adjusted yield earned above what a peer using the same score at the same cutoff would earn |
| The lever | Tightening or loosening the cutoff | Segment selection, channel quality, data that moves the risk frontier, pricing vs. cost of funds, servicing & anticipating macro or policy shifts |
| Who has it | Everyone | Teams with a view, a process & an edge |
| How it shows up | A cutoff move | A shift in the risk frontier: better approval at the same risk, or lower risk at the same approval rate |
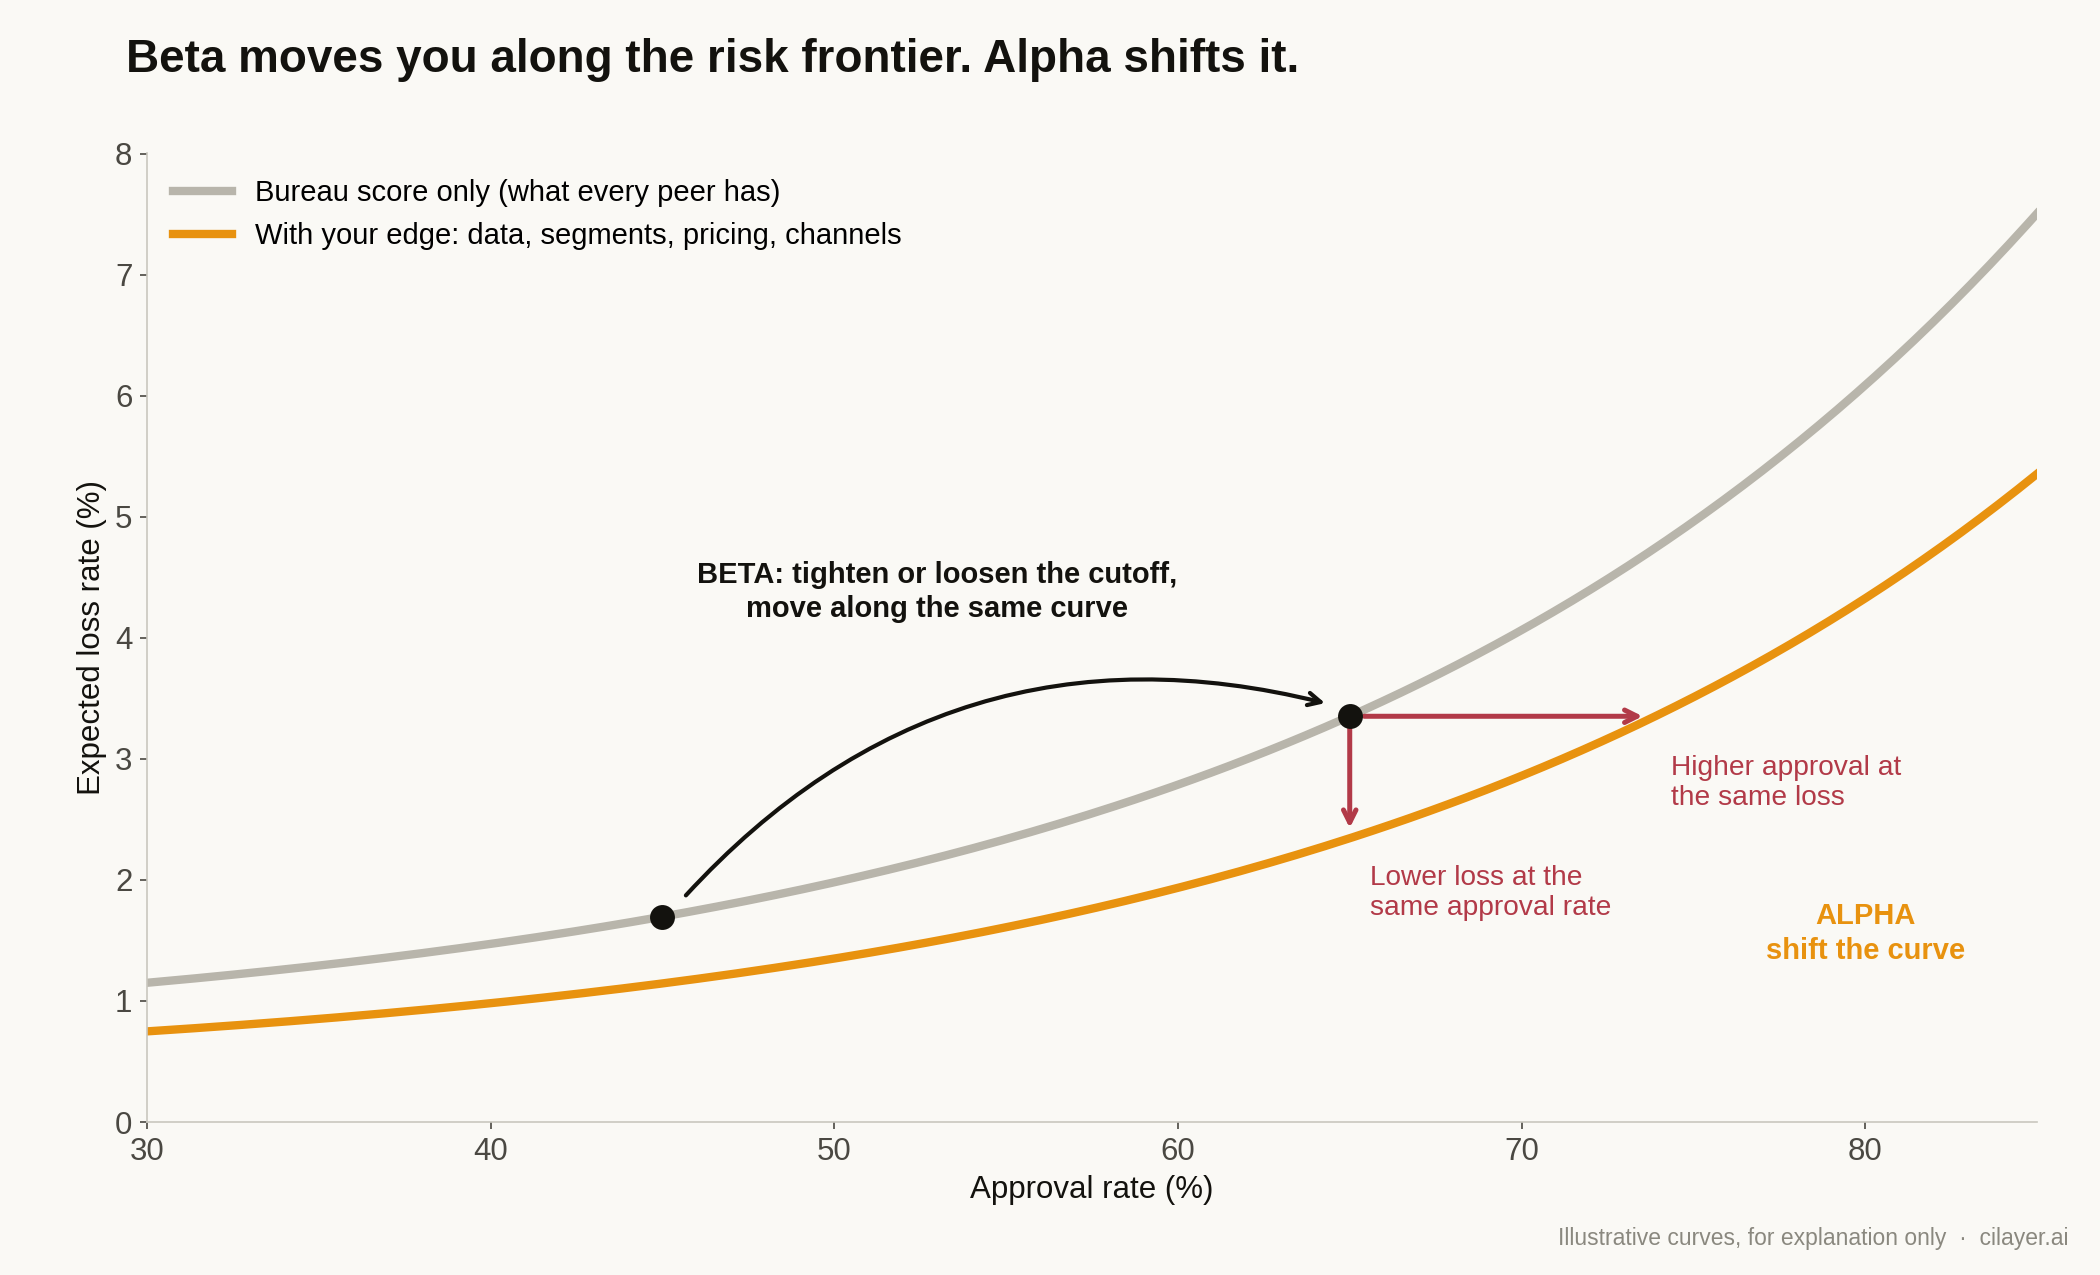
Beta moves you along the risk frontier. Alpha shifts it. Illustrative curves.
A head of credit who only manages the cutoff is managing beta. A head of credit who can explain why their book performs differently from the benchmark, & what they’re doing to widen that gap, is managing alpha.
Writing it down every quarter is how you prove which one you’re doing, including to yourself. That’s what a quarterly credit letter is for.
2. The levers you actually control
This is where alpha is built. Name the levers & say what you did with each.
- Funding & pricing. When rates move, or the forward curve says they will, how do APR, rate caps, term & loan size respond? Know your excess spread, your covenant headroom & where your triggers sit. If your cost of funds rises 50 bps & you’re near a state rate cap, which segments stop being profitable first?
- Charter & licensing. Are state licenses the binding constraint on growth? Is a bank partnership or a national charter the path to expanding product, geography or pricing? Be explicit about what the current structure limits.
- Distribution. Which channels are working, which aren’t & why. Compare each channel’s CAC, loss rate & repeat-borrower lifetime value side by side. A channel with cheap CAC & high losses is not a moat.
- Underwriting moats. Which alternative data, cash flow attributes or new scores improved approval at the same risk, or reduced risk at the same approval rate? Show it as a shift in the risk frontier, not just a cutoff move. If a new data source didn’t help, say that too.
- Servicing & collections. Cure rates, recovery rates & debt sale pricing. Often the cheapest source of loss improvement in the whole business, & often the least discussed.
FAQ
What is the difference between beta & alpha in lending?
Beta is the risk/return you inherit from your score cutoff, the same as any peer using the same bureau score at the same threshold. Alpha is the risk-adjusted yield earned above that peer, from segment selection, channel quality, data that shifts the risk frontier, pricing against cost of funds, servicing & anticipating macro or policy shifts.
How do you show alpha in a credit portfolio?
By explaining why your book performs differently from the benchmark, & what you’re doing to widen that gap. Show underwriting improvements as a shift in the risk frontier (better approval at the same risk, or lower risk at the same approval rate), not just a cutoff move. Unit economics by segment (yield minus losses minus CAC minus servicing cost) puts growth & risk in the same currency.
Related reading on CILayer
- The Quarterly Credit Letter: What Moved, Why & What’s Next
- Cash Flow Underwriting: Momentum vs Habits
- Why Custom Cash Flow Risk Scores Trump Standardized Scores
- Cash Flow Underwriting Adverse Selection Problem
Closing thought
Anyone can set a score cutoff. The market prices that in. What it can’t price in, & what your debt partners are really underwriting, is whether you understand your portfolio better than the benchmark does & can show your work.
A quarterly letter is the simplest way to show it. Here’s how to write one.
We’ve also made the framework a free /quarterly-credit-letter skill: FINCEPTA/CILayer-skills on GitHub.
See reasoning trails on your own decisions
A working session with the team building CILayer, consumer or commercial.